Double Candlesticks
The following are double candlesticks formations that can signal possible bearish or bullish scenarios in the succeeding day(s) ahead. Double candlesticks are powerful formations that can predict the price movement of the stock on the next day. These also work well on various time frames from daily to yearly charts.
Reminder: Candlesticks serve as guidelines. They are not rigid rules such that if a bullish candlestick appears, then it would be certain that the stock would go up the next day. Characteristics of candlesticks vary as well. For example, a hammer candlestick with a considerably long shadow, but not as long as it should be can still be considered as a hammer formation.
Bullish Engulfing
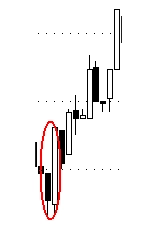
- Commonly appears in any type of market
- Has a long white real body candlestick that “engulfs” the entire real body of the previous candlestick
- Effect: There is a likelihood that the stock can go up the succeeding day
Bearish Engulfing
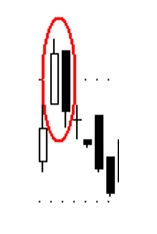
- Commonly appears in any type of market
- Has a long black real body candlestick that “engulfs” the real body of the previous candlestick
- Effect: There is a likelihood that the stock can go down the succeeding day
Piercing Pattern
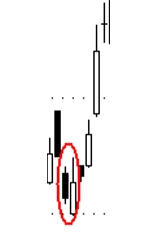
- Commonly appears in any market
- The previous candlestick must be black and the succeeding candlestick must be white
- The white candlestick must penetrate by its real body at least the midpoint of the black candlestick
- The higher the penetration of the white candlestick’s real body, the more bullish the signal
- Effect: There is a likelihood that the stock can go up the succeeding day
Dark Cloud Cover
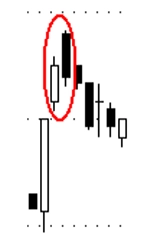
- Commonly appears in any market
- The previous candlestick must be white and the succeeding candlestick must be black
- The black candlestick must open above the white candlestick’s high and closes within the white candlestick’s real body
- The deeper the penetration by the black candlestick, the more bearish the signal
- Effect: There is a likelihood that the stock can go down the succeeding day
Bullish Harami
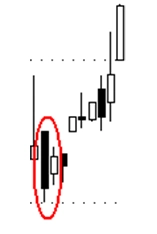
- Usually appears in a downtrend
- Formed by a long black candlestick followed by a small real body white candlestick within the black candlestick
- Not a significant reversal sign as compared to other patterns
- Effect: Possible reversal sign or could mean a brake in the market
Bearish Harami
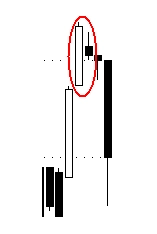
- Usually appears in an uptrend
- Formed by a long real body white candlestick followed by a small real body black candlestick within the white candlestick
- Not a significant reversal sign as compared to other patterns
- Effect: Possible reversal sign or could mean a brake in the market
Bullish Harami Cross
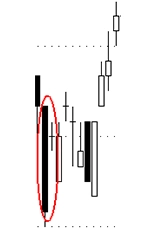
- Usually appears in a downtrend
- Formed by a black candlestick that is succeeded by a Doji star within its real body.
- The smaller the Doji star, the more potent the pattern
- Also known as the bullish Petrifying pattern
- Effect: Signals a major reversal
Bearish Harami Cross
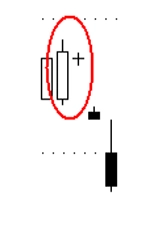
- Usually appears in an uptrend
- Formed by a white candlestick that is succeeded by a Doji star within its real body.
- The smaller the Doji star, the more potent the pattern
- Also known as the bearish Petrifying pattern
- Effect: Signals a major reversal
Tweezer Top
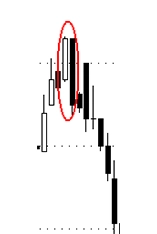
- Appears in an uptrend
- Usually occurs in an extended uptrend
- Must have two candlesticks either black or white that have more or less matching highs
- Effect: Signals that the stock has a chance to go down on the following day.
Tweezer Bottom
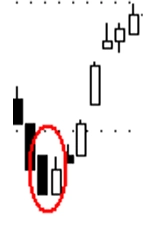
- Appears in a downtrend
- Usually occurs in an extended downtrend
- Must have two candlesticks either black or white that have more or less matching lows
- Effect: Signals that the stock has a chance to go up on the following day.
