Multiple Candlesticks
The following are multiple candlesticks formations that can signal possible bearish or bullish scenarios in the succeeding day(s) ahead. Multiple candlesticks formations have a high reliability to predict the price movement or the trend of the stock on following days. As a general rule, the more candlesticks are used in a formation, the more potent the formation is in determining price change. These also work well on various time frames from daily to yearly charts.
Reminder: Candlesticks serve as guidelines. They are not rigid rules such that if a bullish candlestick appears, then it would be certain that the stock would go up the next day. Characteristics of candlesticks vary as well. For example, a hammer candlestick with a considerably long shadow, but not as long as it should be can still be considered as a hammer formation.
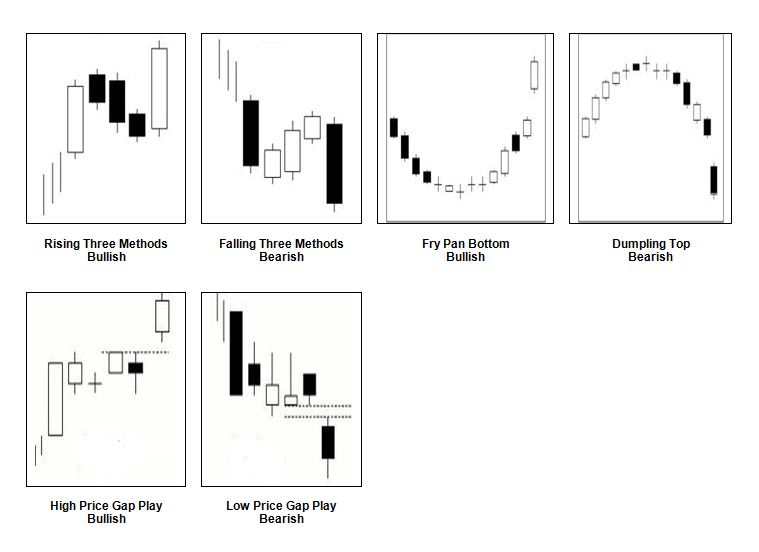
Rising Three Methods
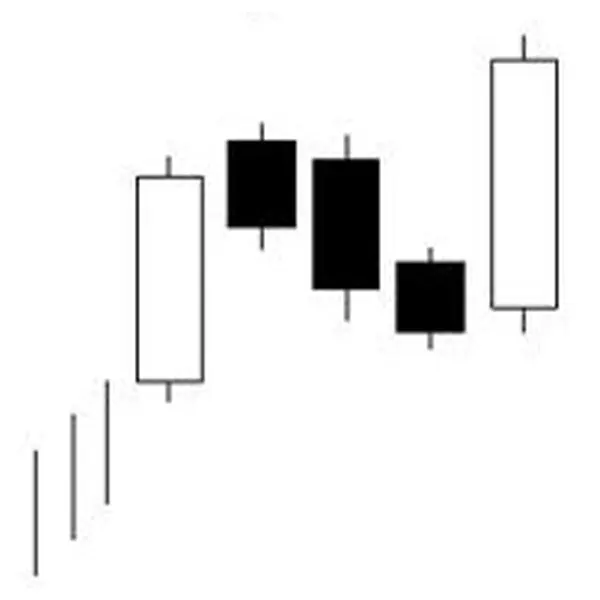
- Usually appears in an uptrend
- A group of candlesticks wherein a long white candlestick forms on the first day followed by two to three small real bodied black or white candlesticks trending down within the range of the first day candlestick’s real body. Finally, a long white candlestick forms on the last day that opens above the previous day’s close and closes above the first day candlestick’s close.
- There has to be at least two small real bodied candlesticks between the first day’s and last day’s candlesticks
- As much as possible the small real bodied candlesticks should be within the first day candlestick’s range
- As much as possible the last day candlestick’s real body should engulf the smaller candlesticks
- Effect: Signals bullishness with a brief pause or correction before continuing the uptrend
Falling Three Methods
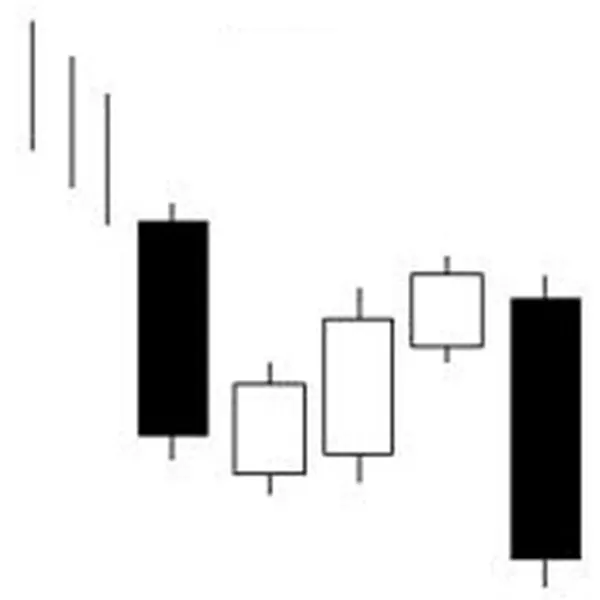
- Usually appears in a downtrend
- A group of candlesticks wherein a long black candlestick forms on the first day followed by two to three small real bodied black or white candlesticks trending up within the range of the first day candlestick’s real body. Finally, a long black candlestick forms on the last day that opens belows the previous day’s close and closes below the first day candlestick’s close.
- There has to be at least two small real bodied candlesticks between the first day’s and last day’s candlesticks
- Usually the small read bodied candlesticks are white
- As much as possible the small real bodied candlesticks should be within the first day candlestick’s range
- As much as possible the last day candlestick’s real body should engulf the smaller candlesticks
- Effect: Signals bearishness with a brief retracement before continuing the downtrend
Fry Pan Bottom
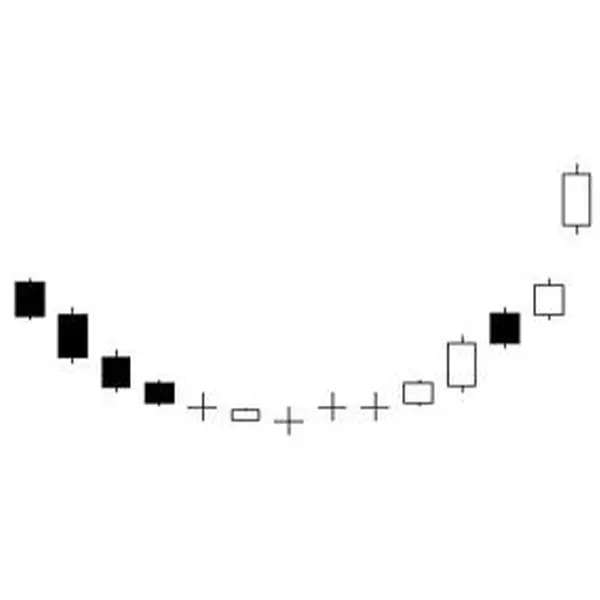
- Usually appears in a downtrend
- Has small real bodied candlesticks whether black or white that form a concave design
- Must have a confirming bullish Belt-Hold Line candlestick that gaps up to complete the pattern
- Effect: Signals a possible bottom and bullish uptrend forming.
Dumpling Top
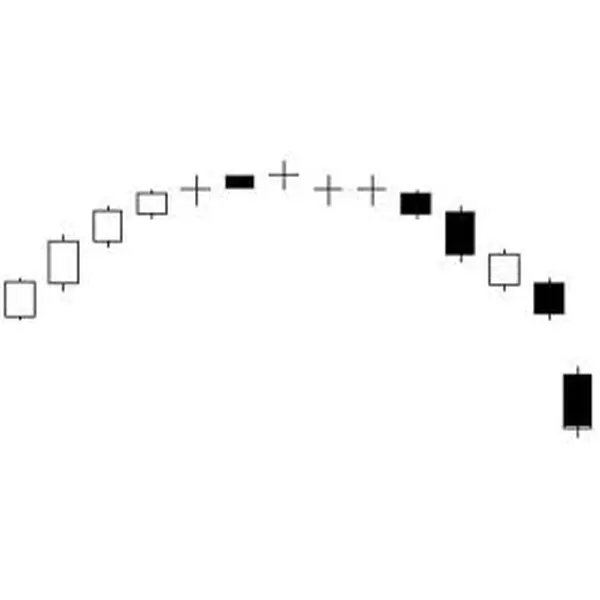
- Usually appears in an uptrend
- Has small real bodied candlesticks whether black or white that form a convex design
- Must have a confirming bearish Belt-Hold Line candlestick that gaps down to complete the pattern
- Effect: Signals possible peak and a bearish downtrend forming.
High Price Gapping Play
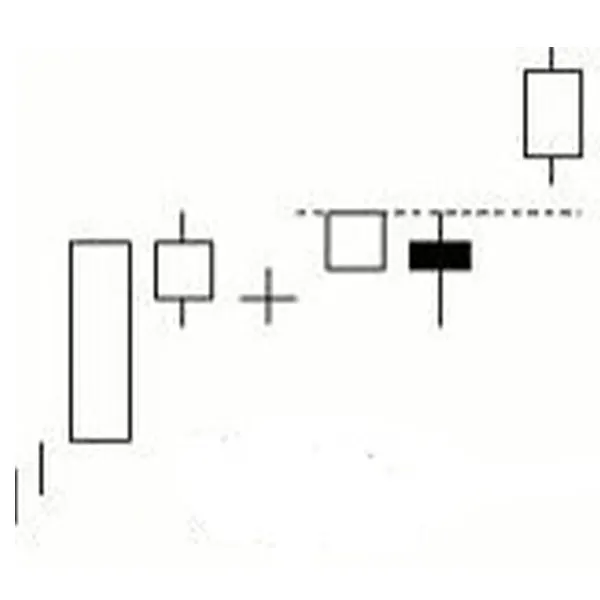
- Usually appears in an uptrend
- After a sharp one or two advance, the market consolidates within a range forming a series of small real bodied candlesticks, which can either be black or white. Then, a bullish candlestick is formed by a gap up to complete the pattern.
- The first one or two candlesticks usually have long and white real bodies
- Consolidation should not last for more than 11 sessions (sessions can be days, weeks, or months depending on type of chart)
- Effect: Signals a continuation of the uptrend
Low Price Gapping Play
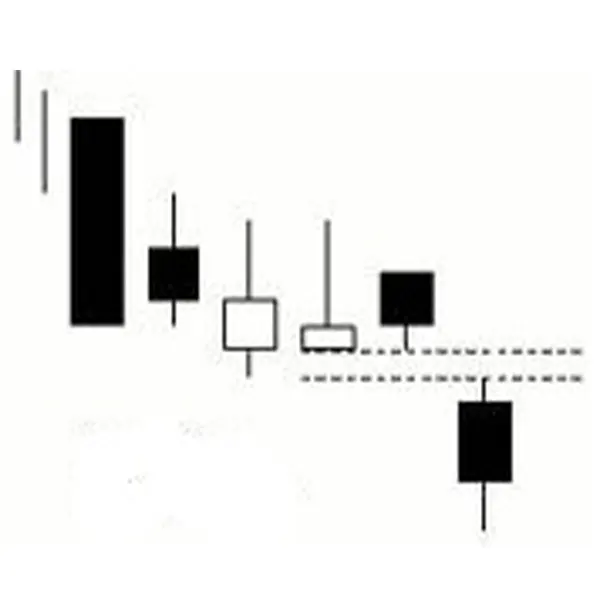
- Usually appears in a downtrend
- After a sharp one or two decline, the market consolidates within a range forming a series of small real bodied candlesticks, which can either be black or white. Then, a bearish candlestick is formed by a gap down to complete the pattern.
- The first one or two candlesticks usually have long and black real bodies
- Consolidation should not last for more than 11 sessions (sessions can be days, weeks, or months depending on type of chart)
- Effect: Signals a continuation of the downtrend
