Moving Average Convergence-Divergence (MACD)
What is the MACD?
The Moving Average Convergence-Divergence (MACD) is a price momentum oscillator that can be a good trend-following/laggard indicator. The indicator comprises of two lines — the first one is a difference of two exponential moving averages, which is known as the MACD line, while the second one is an exponential moving average of the first one, which acts as a signal line.
Since the MACD line is the difference of the two exponential moving averages, a histogram or bar graph is shown in the indicator that graphs the divergence between the two lines.
Lastly, there is a center line, which is set to zero.

Parts of the MACD indicator
How to use it:
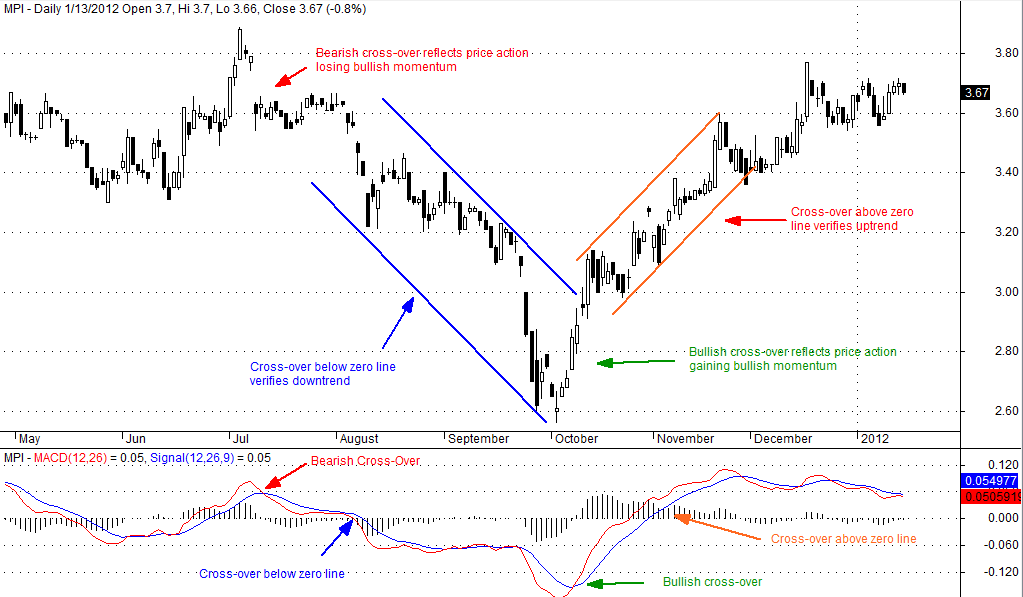
When the MACD line crosses above the signal line, it means the stock is gaining bullish momentum. However, when the MACD crosses below the signal line, it means the stock is gaining bearish momentum. Asides from that when the MACD line crosses above the zero line from a negative territory, it means that the stock can experience or verifies a change in trend (from a bearish trend to a bullish trend), but when the line crosses below the zero line from a positive territory, it means the stock could be ending its bullish trend to form a bearish trend. If the MACD moves along the center line, it means the stock could just be consolidating at a certain range.
The histogram helps in determining the strength of a stock’s trend. A widening histogram suggests that the on-going trend has still gas to go up, but a narrowing histogram indicates that the trend may be fizzling out.

In-set shows cross-overs of the MACD line that signal bullishness or bearishness of a stock.
