Moving Average (MA)
What is a Moving Average?
Moving averages are trend following indicators that smooths the price direction of the stock and filters out noise. There are numerous types of moving averages, but the most commonly used are the Simple Moving Average and the Exponential Moving Average.
Simple Moving Average
The simple moving average (SMA) is computed by getting the average price of a security over a specific period. The calculation covers a specified number of days and the average is “moving,” meaning old data is dropped as new data becomes available. For example, a 5 day simple moving average covers a stock’s closing price for the last 5 days. Tomorrow, the closing price of the stock will be the new input in the formula while the oldest closing price will be dropped to keep the moving average going. The SMA is less price sensitive as compared to the Exponential Moving Average and is used to determine potential supports and resistances.
How to Use it:
Using simple moving average, once can easily tell the direction of the stock because the indicator follows the price of the stock. An SMA going up could mean the trend of the stock could be going up whereas an SMA going down could mean the trend of the stock could be going down.
SMA’s time frame can vary from 2 to x number of days. Usually a 10-35 day SMA is used to determine the short-term trend of a stock and a 50-200 day SMA is used to determine the medium to long-term trend of a stock. The shorter moving average graphs a sensitive line while a longer moving average graphs a smoother line. Although shorter moving averages quickly change direction based on price movement, it is more prone to whipsaws. On the other hand, longer moving averages are slow moving, but shows a clear direction of the stock’s trend.
Since an SMA computes the average price of a stock for a given time frame, it can also be used to determine support and resistance. When prices go below the SMA, then it could mean a breakdown of the stock. However, if prices go above the SMA, then it could mean a breakout of the stock.
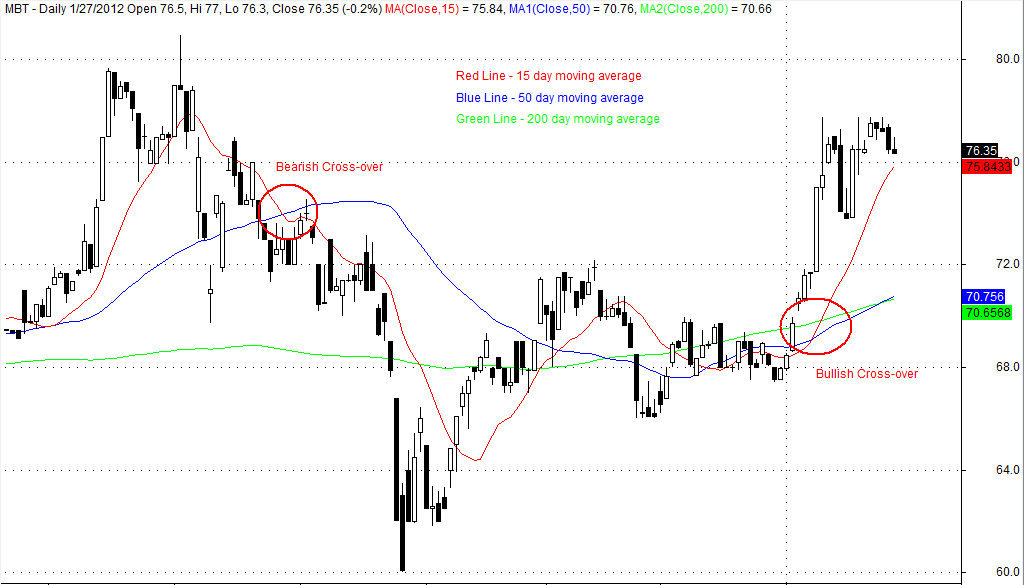
Finally, cross-over of SMAs often occurs. If a shorter SMA crosses above a longer SMA, then the stock could move bullishly. However, if it crosses below a longer SMA, the stock could move bearishly.

Inset shows three simple moving averages.
Exponential Moving Average
An exponential moving average (EMA) is a simple moving average that places greater weight on recent prices. It is more sensitive than the simple moving average; therefore, turns sharply when there are trend changes. Although the EMA can quickly signal a possible change in trend of the stock, it is more prone to whipsaws.
