Relative Strength Index (RSI)
What is RSI?
The Relative Strength Index (RSI) is a momentum oscillator that measures the strength or weakness of a stock based on the rate of change of its price movement. The oscillator is represented by a line, which is based on a formula that takes into consideration the average gain and average loss of the stock on a given time frame, usually 14-15 days. Its chart has a range from 0 to 100.
How to use it:
Overbought/Oversold:
The RSI has two important levels: the 30 level and the 70 level. When the RSI reaches the 30 level or below, it simply means that the stock has reached oversold conditions and there is a possibility that the stock can rebound. On the other hand, when the RSI reaches the 70 level or above, it means that the stock has reached overbought conditions and there is a possibility that the stock may go down.
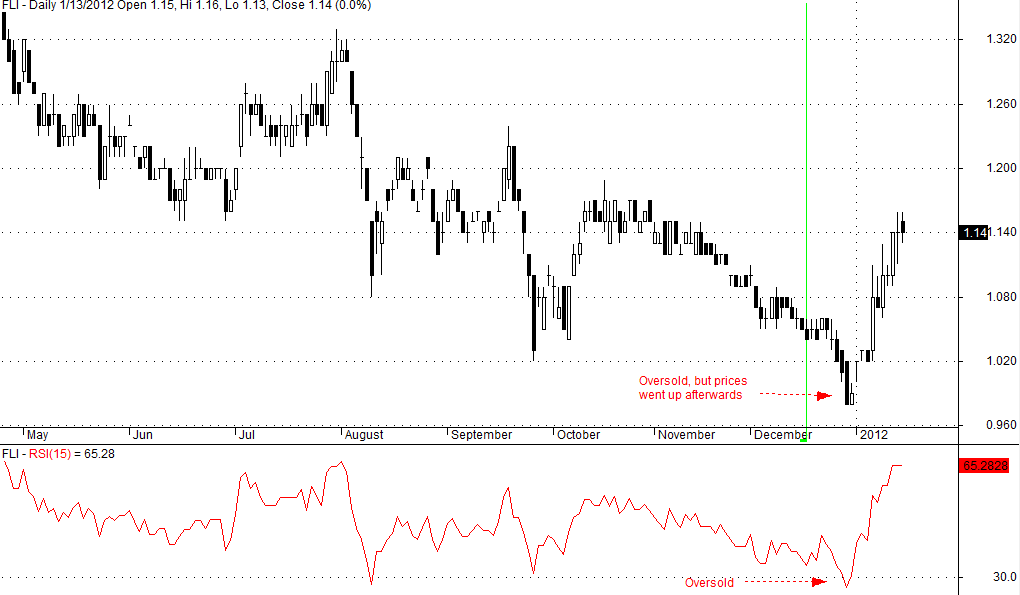
Inset shows the stock reached oversold conditions with RSI at 26.80 last 12-28-11.
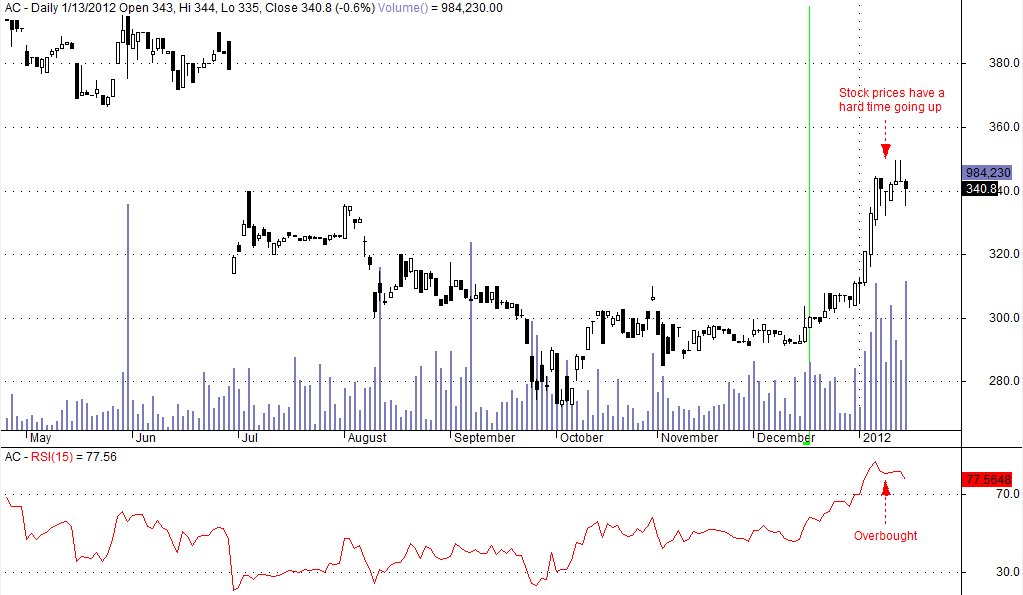
Inset shows stock has an RSI of 77.56, which is considered to be overbought.
Failure Swing:
A bullish failure swing occurs when the RSI falls below the 30 level, pulls back, holds or moves down again, but breaks out from the prior high.
Example: RSI falls to 20, pulls back to 25, goes down to 22, then breaks out from the prior high of 25
A bearish failure swing occurs when the RSI goes above the 70 level, throws back, holds or moves up again, but breaks below the prior low.
Example: RSI goes to 80, throws back to 68, goes up to 78, then breaks down from the prior low of 68
Divergences:
There are instances when the RSI and the price of the stock form divergences. First is the bullish divergence or when the price forms a lower low, but the RSI forms a higher low. Secondly, there is the bearish divergence or when the price forms a higher high, but the RSI forms a lower high.
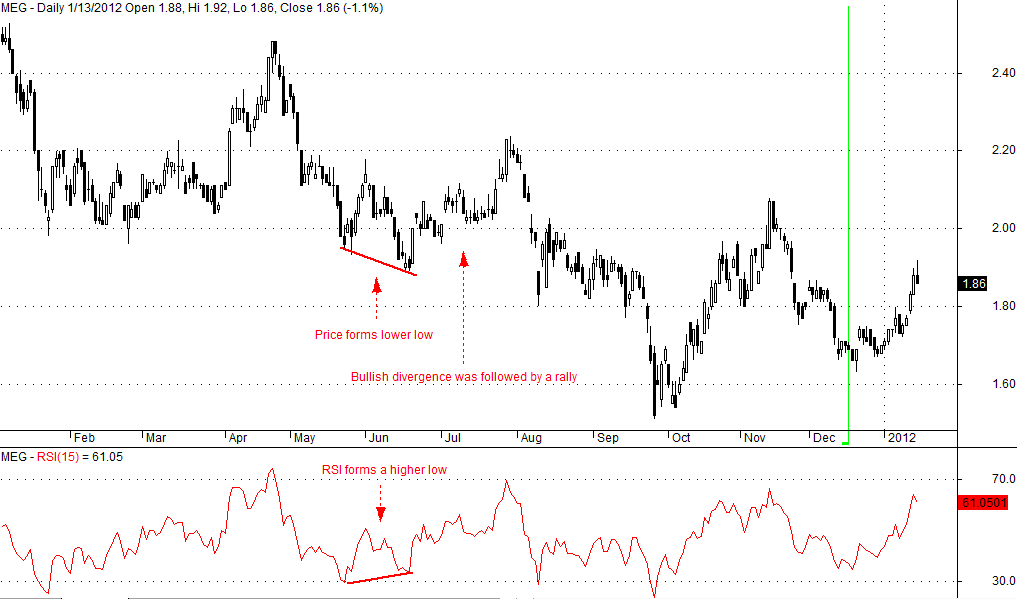
Inset shows a bullish divergence wherein the stock's price rallied after forming the divergence.
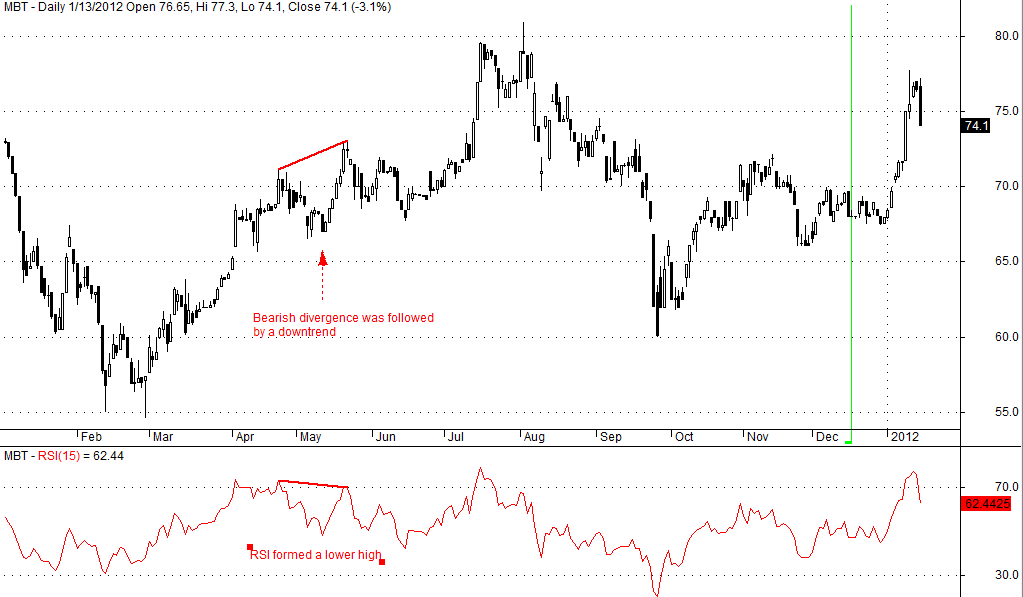
Inset shows bearish divergence wherein price went down to form a short-term downtrend before going back up again.
Reversals:
Reversals are opposites of divergences. When the stock’s price makes a lower high, but the RSI makes a higher high, then the stock is forming a negative reversal. However, when the stock’s price makes a higher low, but the RSI makes a lower low, then the stock is forming a positive reversal.
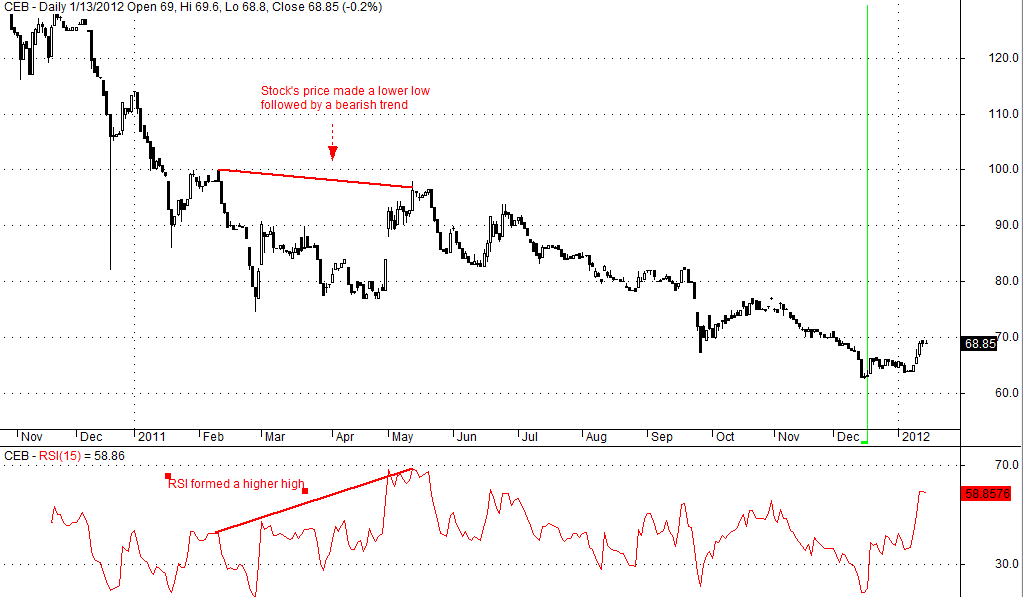
Inset shows negative reversal wherein the stock continues its downtrend after forming the reversal.
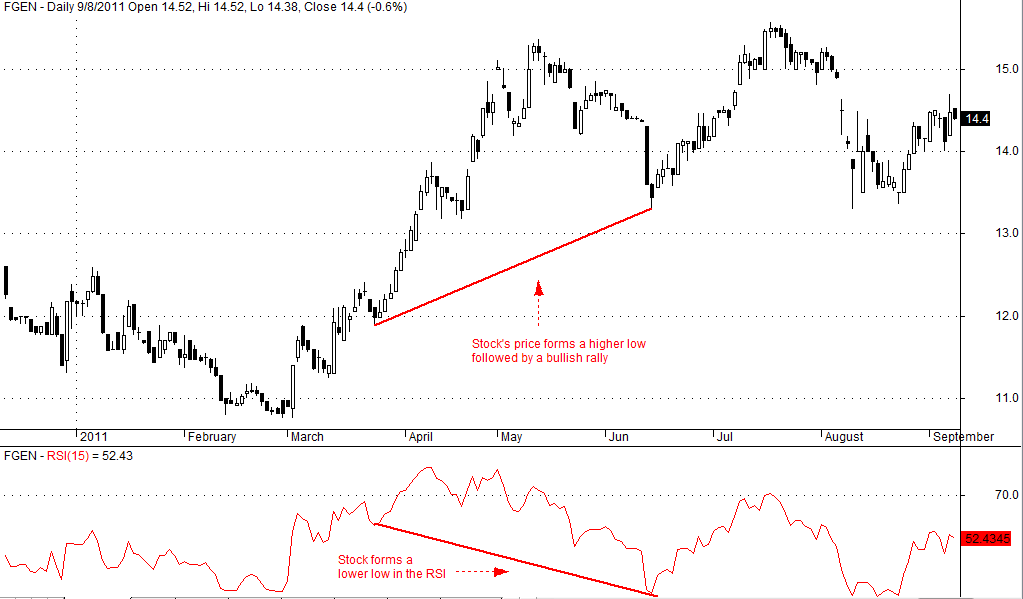
Inset shows positive reversal wherein the stock rallies after forming the positive reversal.
